St. John’s

The Housing Needs Assessment data produced by HART’s HNA Tool

The Housing Assessment Resource Tools (HART) project is funded by the Canada Mortgage and Housing Corporation (CMHC) to research solutions to Canada’s Housing Crisis. We offer comprehensive, equity-focused solutions to the unique problems faced by communities of all shapes and sizes cross-country. The goal of the project is to develop standardized, replicable and sustainable tools, along with associated public information and training, to improve the quality of housing supply decision-making at all levels of government across Canada.

The following data, which was compiled using our Housing Needs Assessment Tool, represents information about Housing Need in St. John’s, NL using 2016 data from Statistics Canada. 2021 data will be published in 2023.

Key findings
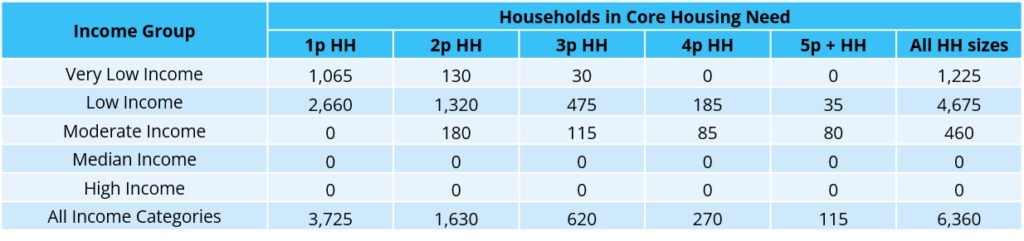
  • There is an existing deficit of 5,135 homes costing under $1,400/month
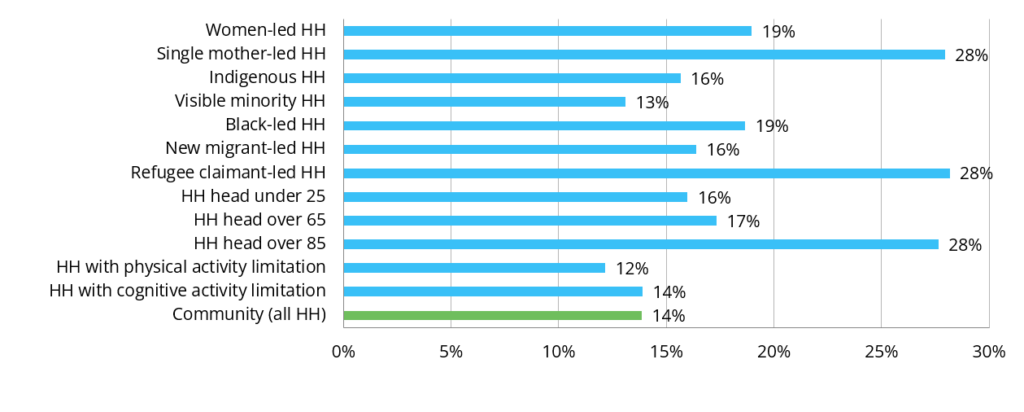
  • Refugee claimant, single mother led, and senior households are 2x more likely to be in Core Housing Need
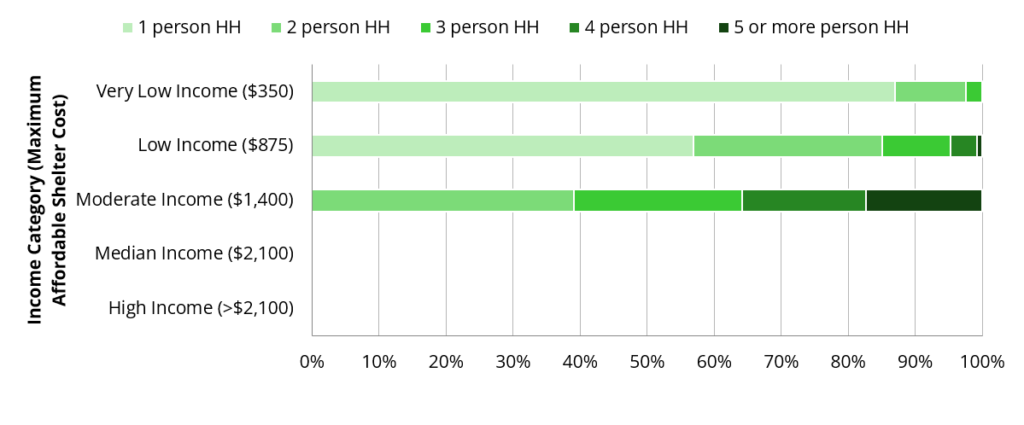
  • 60% of homes costing between $876/m to $1,400/m require space for 3 or more people

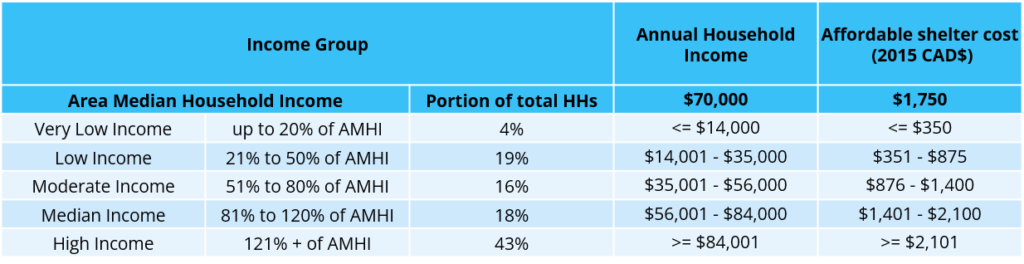
Area Median Household Income (AMHI) Categories and Shelter Costs (2016)

This table shows the income categories used by the HART project, and the characteristics of each group, including their income range and affordable shelter cost.

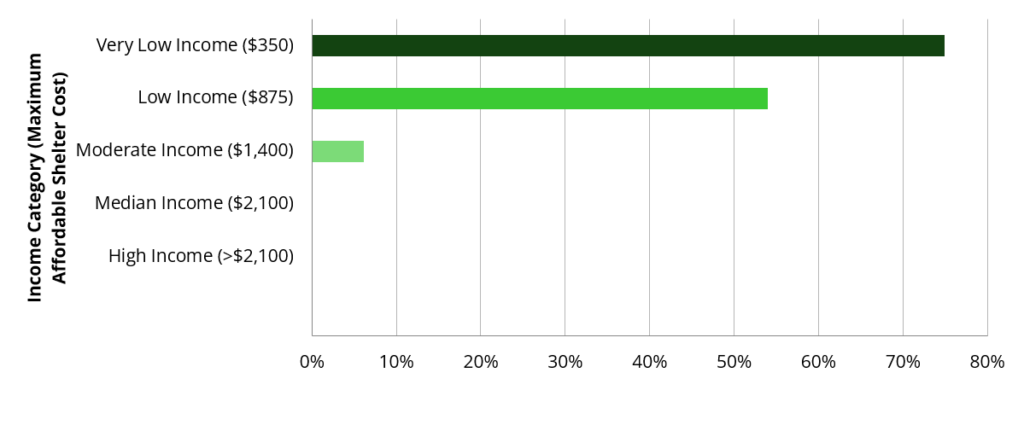
Percent of Households in Core Housing Need, by Household Income Category (2016)

This graph shows the total proportion of households and number of households that were in core housing need in the community according to the 2016 census data. For example, this chart shows that 54% of households in the Low Income category (maximum affordable monthly shelter cost is $875) were in Core Housing Need.

Percent of Household Size Categories in Core Housing Need, by Area Median Household Income (AMHI) (2016)

This graph shows the breakdown of household size for households in core housing need. For example, this graph shows that of Moderate Income households (maximum affordable monthly shelter cost $1,400), almost 60% of households in core housing need were made up of three or more people.

Total Affordable Housing Deficit (2016)

This table shows the 2016 existing housing deficit at each income category level. For example, in 2016 there was a deficit of at least 6,360 homes costing below $1,400, the maximum affordable monthly shelter cost for Moderate Income households. This number does not necessarily indicate a lack of homes, but a lack of homes at or below the maximum affordable shelter cost for this income category.

Percentage of Households (HHs) in Core Housing Need, by Priority Population (2016)

This graph shows the proportion of marginalized households in core housing need against the proportion of all households in core housing need. For example, single mother-led households, refugee claimant-led households and senior-led households are 2x as likely to be in core housing need than the region as a whole.

For more information about the HART HNA data, read our FAQ.