The Housing Needs Assessment data produced by HART’s HNA Tool
The Housing Assessment Resource Tools (HART) project is funded by the Canada Mortgage and Housing Corporation (CMHC) to research solutions to Canada’s Housing Crisis. We offer comprehensive, equity-focused solutions to the unique problems faced by communities of all shapes and sizes cross-country. The goal of the project is to develop standardized, replicable and sustainable tools, along with associated public information and training, to improve the quality of housing supply decision-making at all levels of government across Canada.
The following data, which was compiled using our Housing Needs Assessment Tool, represents information about Housing Need in Edmonton, AB using 2016 data from Statistics Canada. 2021 data is now available in our Housing Needs Assessment Tool.
Over 80% of homes costing over $1,760/m require space for three or more people
There is a deficit of34,215 homes costing under $1,100/m
Marginalized communities are 2 to 3x as likely to be in Core Housing Need
Area Median Household Income (AMHI) Categories and Shelter Costs (2016)
This table shows the income categories used by the HART project, and the characteristics of each group, including their income range and affordable shelter cost.
Percent of Households in Core Housing Need, by Household Income Category (2016)
This graph shows the total proportion of households and number of households that were in core housing need in the community according to the 2016 census data. For example, this chart shows that nearly 80% of households in the Very Low Income category (maximum affordable monthly shelter cost is $440) were in Core Housing Need.
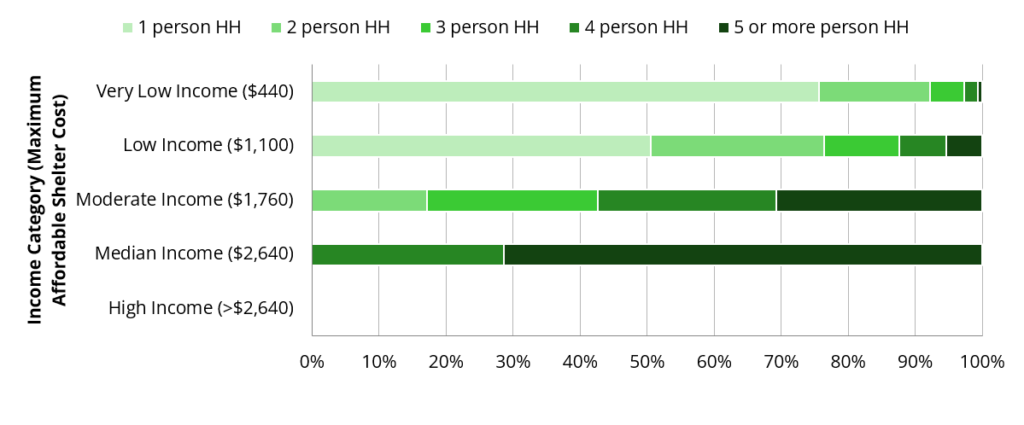
Percent of Household Size Categories in Core Housing Need, by Area Median Household Income (AMHI) (2016)
This graph shows the breakdown of household size for households in core housing need. For example, this graph shows that of Moderate Income households (maximum affordable monthly shelter cost $1,760), nearly 100% of households in core housing need were made up of two or more people, and over 80% require space for three or more people.
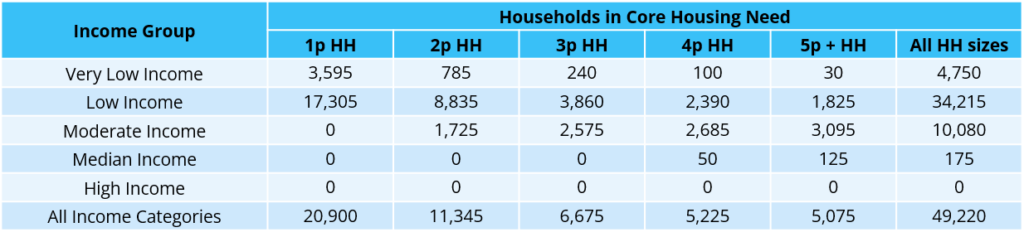
Total Affordable Housing Deficit (2016)
This table shows the 2016 existing housing deficit at each income category level. For example, in 2016 there was a deficit of at least 3,860 three-person homes that were affordable to Low Income households. This number does not necessarily indicate a lack of homes, but a lack of homes at or below the maximum affordable shelter cost for this income category.
Percentage of Households (HHs) in Core Housing Need, by Priority Population (2016)
This graph shows the proportion of marginalized households in core housing need against the proportion of all households in core housing need. For example, single mothers are overwhelmingly more likely to be in Core Housing Need than the rest of the community, and around 1 in 4 black-led, refugee-led and very elderly-led households are in need.
For more information about the HART HNA data, read our FAQ.