The following data, which represents the Core Housing Need in the City of Montréal from the 2021 Census, was compiled using HART data custom ordered from Statistics Canada. To access all available 2021 data in raw format, please visit our dataverse. Our Housing Needs Assessment Tool will be updated with 2021 data in Summer 2023.
Understanding 2021 Core Housing Need data
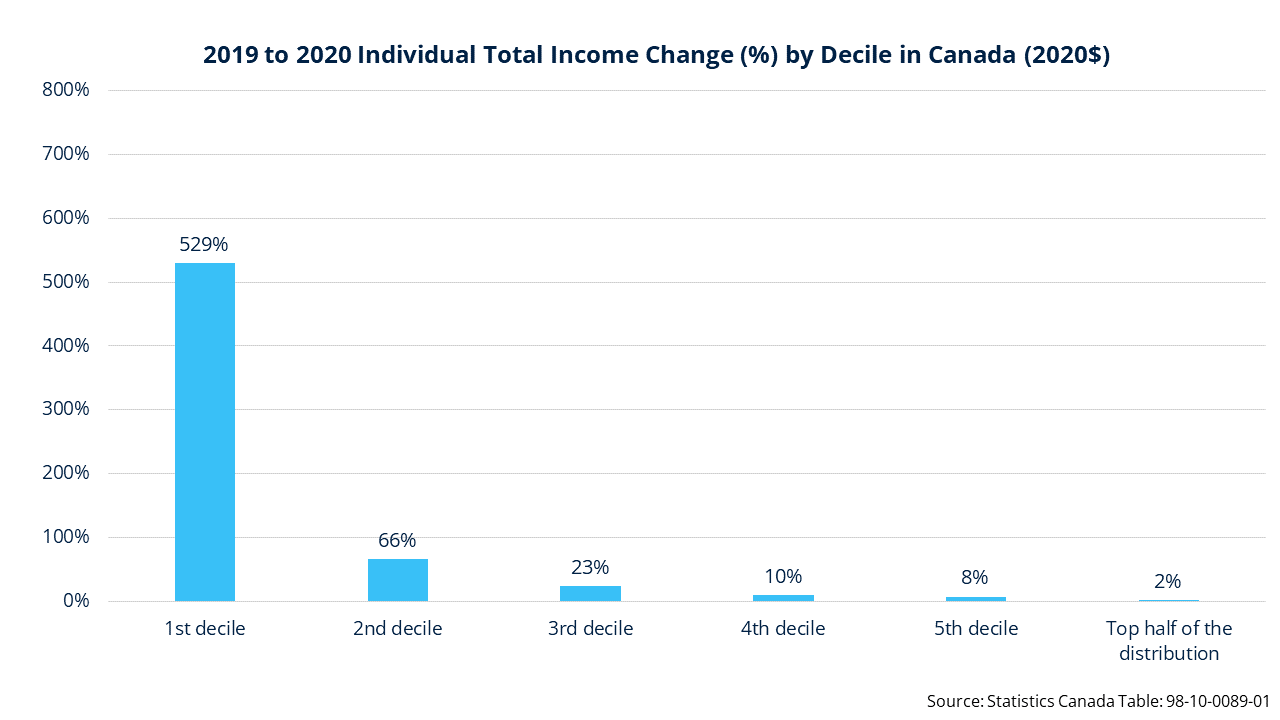
The 2021 Census data was collected in May 2020 during the first phase of the Covid-19 pandemic, when the federal government was distributing the Canada Emergency Response Benefit (CERB). 35.2% of all Canadian workers who earned at least $5,000 in 2019 received CERB payments in 2020, up to a maximum of $14,000 from May to September 2020. Low-wage workers were the most likely to receive CERB payments.
For the lowest-earning households, income in 2020 increased by up to 800% temporarily. After CERB ended, some households went on EI (which paid $100 less per week than CERB). the Canadian Centre for Policy Alternatives predicted that almost three-quarters of former CERB recipients would be worse off than before they received aid.
The poorest households are in the greatest housing need in every community, and at the point in time that the census was collected, the incomes of these households were drastically improved.
For almost every community in Canada, it is vital to remember that CERB likely resulted in artificially depressed Core Housing Need. Furthermore, the economic circumstances from 2021-2023 have also been far more volatile in many communities across Canada, so many communities have also seen a dramatic increase in home costs, rents, and expenses, which should be considered when evaluating this data.
Even with all these considerations which would implicate a significant undercount of Core Housing Need, Montréal still faces an existing deficit of almost 88,000 homes, 83,750 of which must cost $838 per month or less.
Income Categories and Shelter Costs (2021)
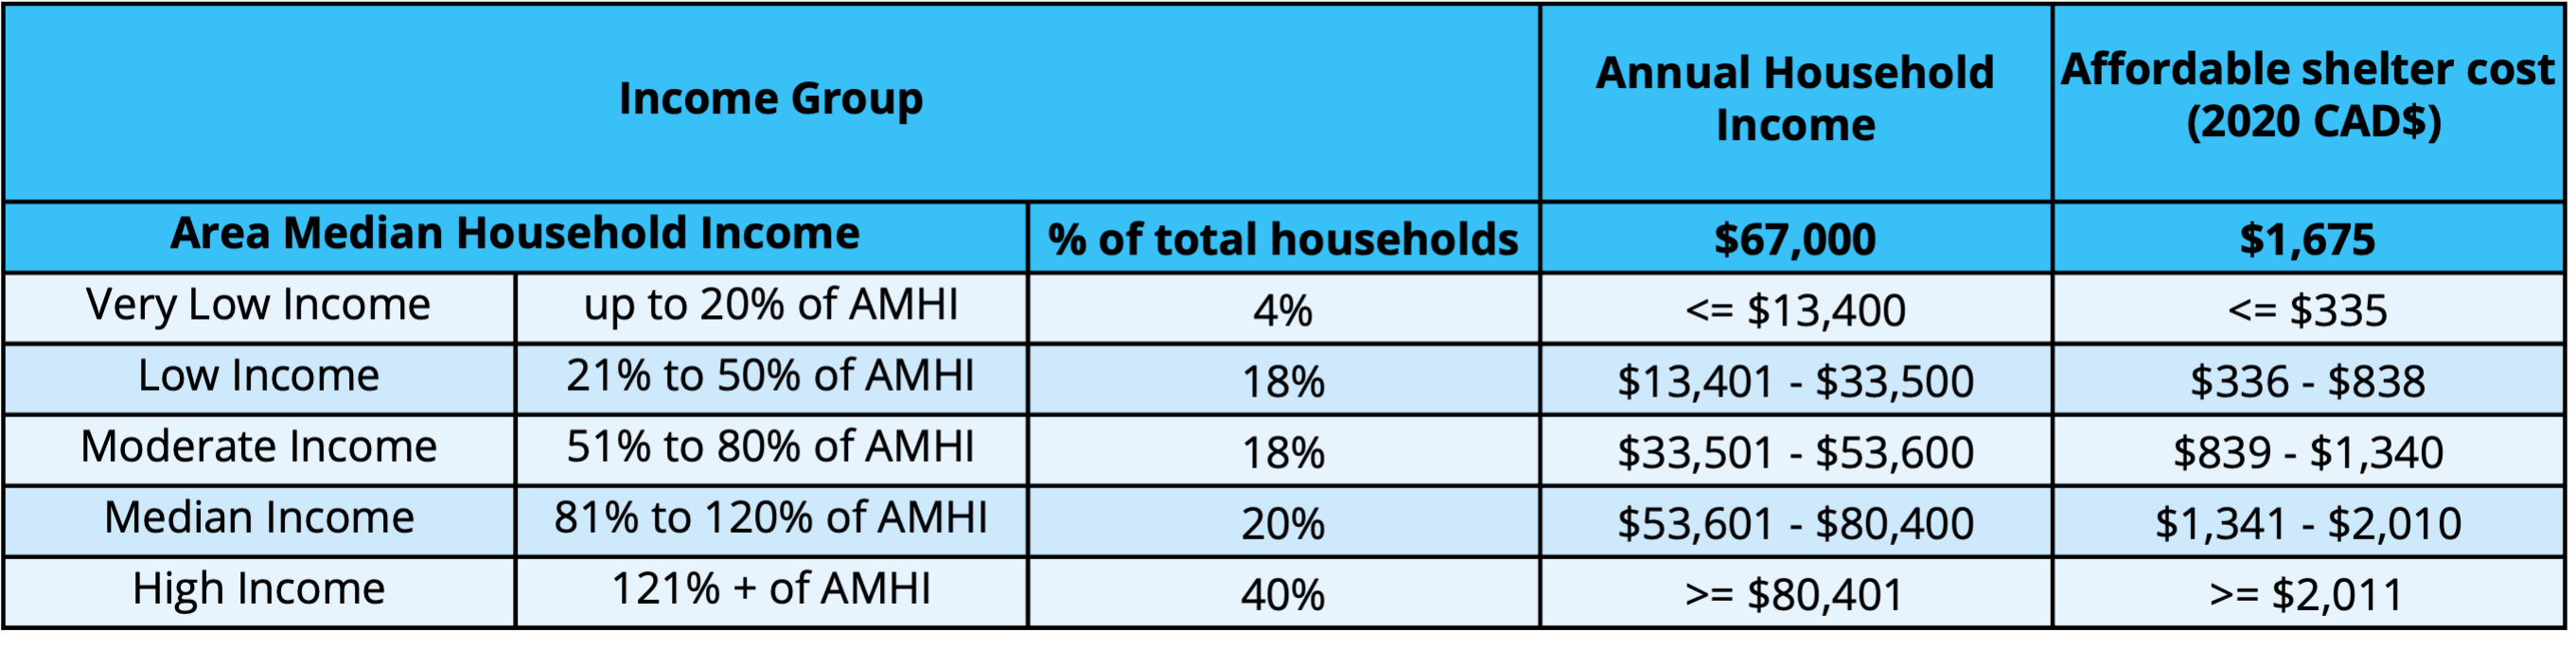
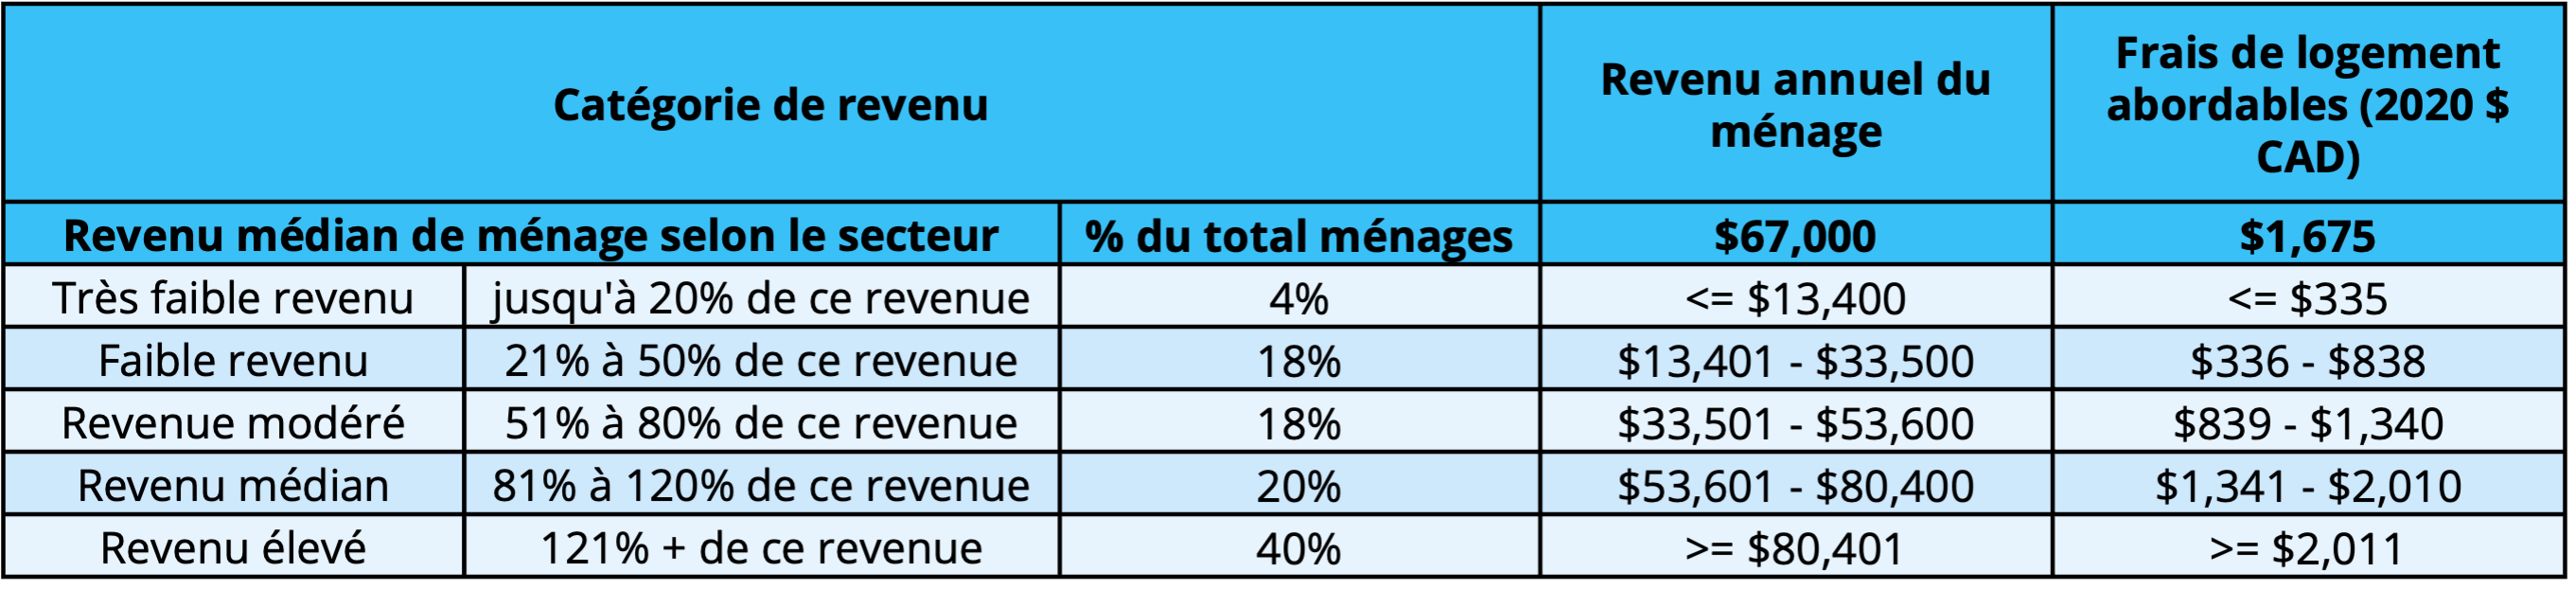
This table shows the income categories used by the HART project, and the characteristics of each group, including their income range and affordable shelter cost.
Percent of Households in Core Housing Need, by Income Categories (2021)
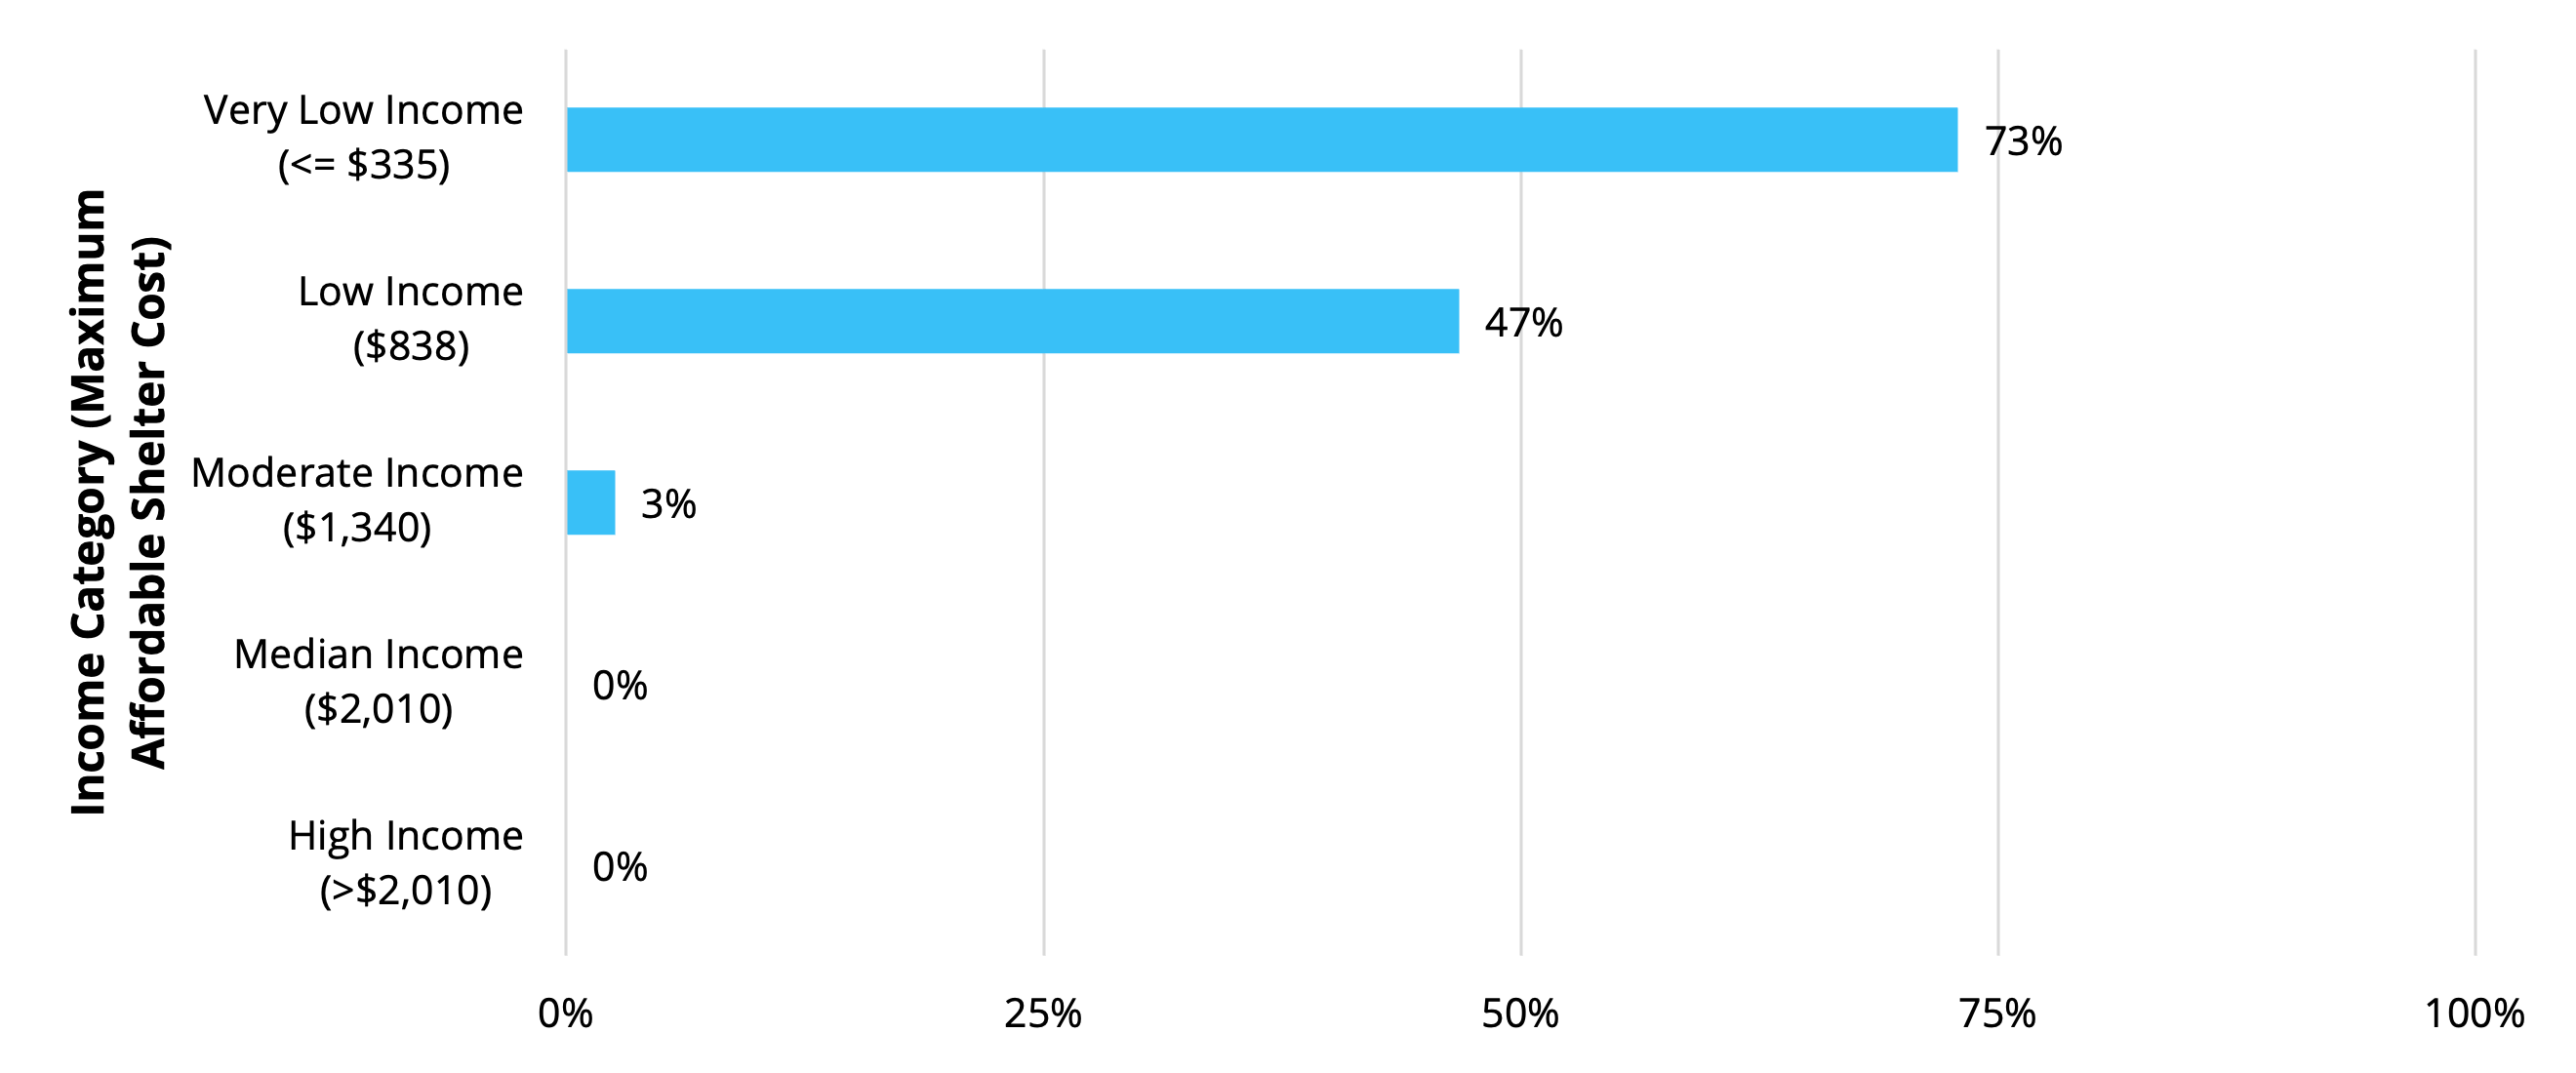
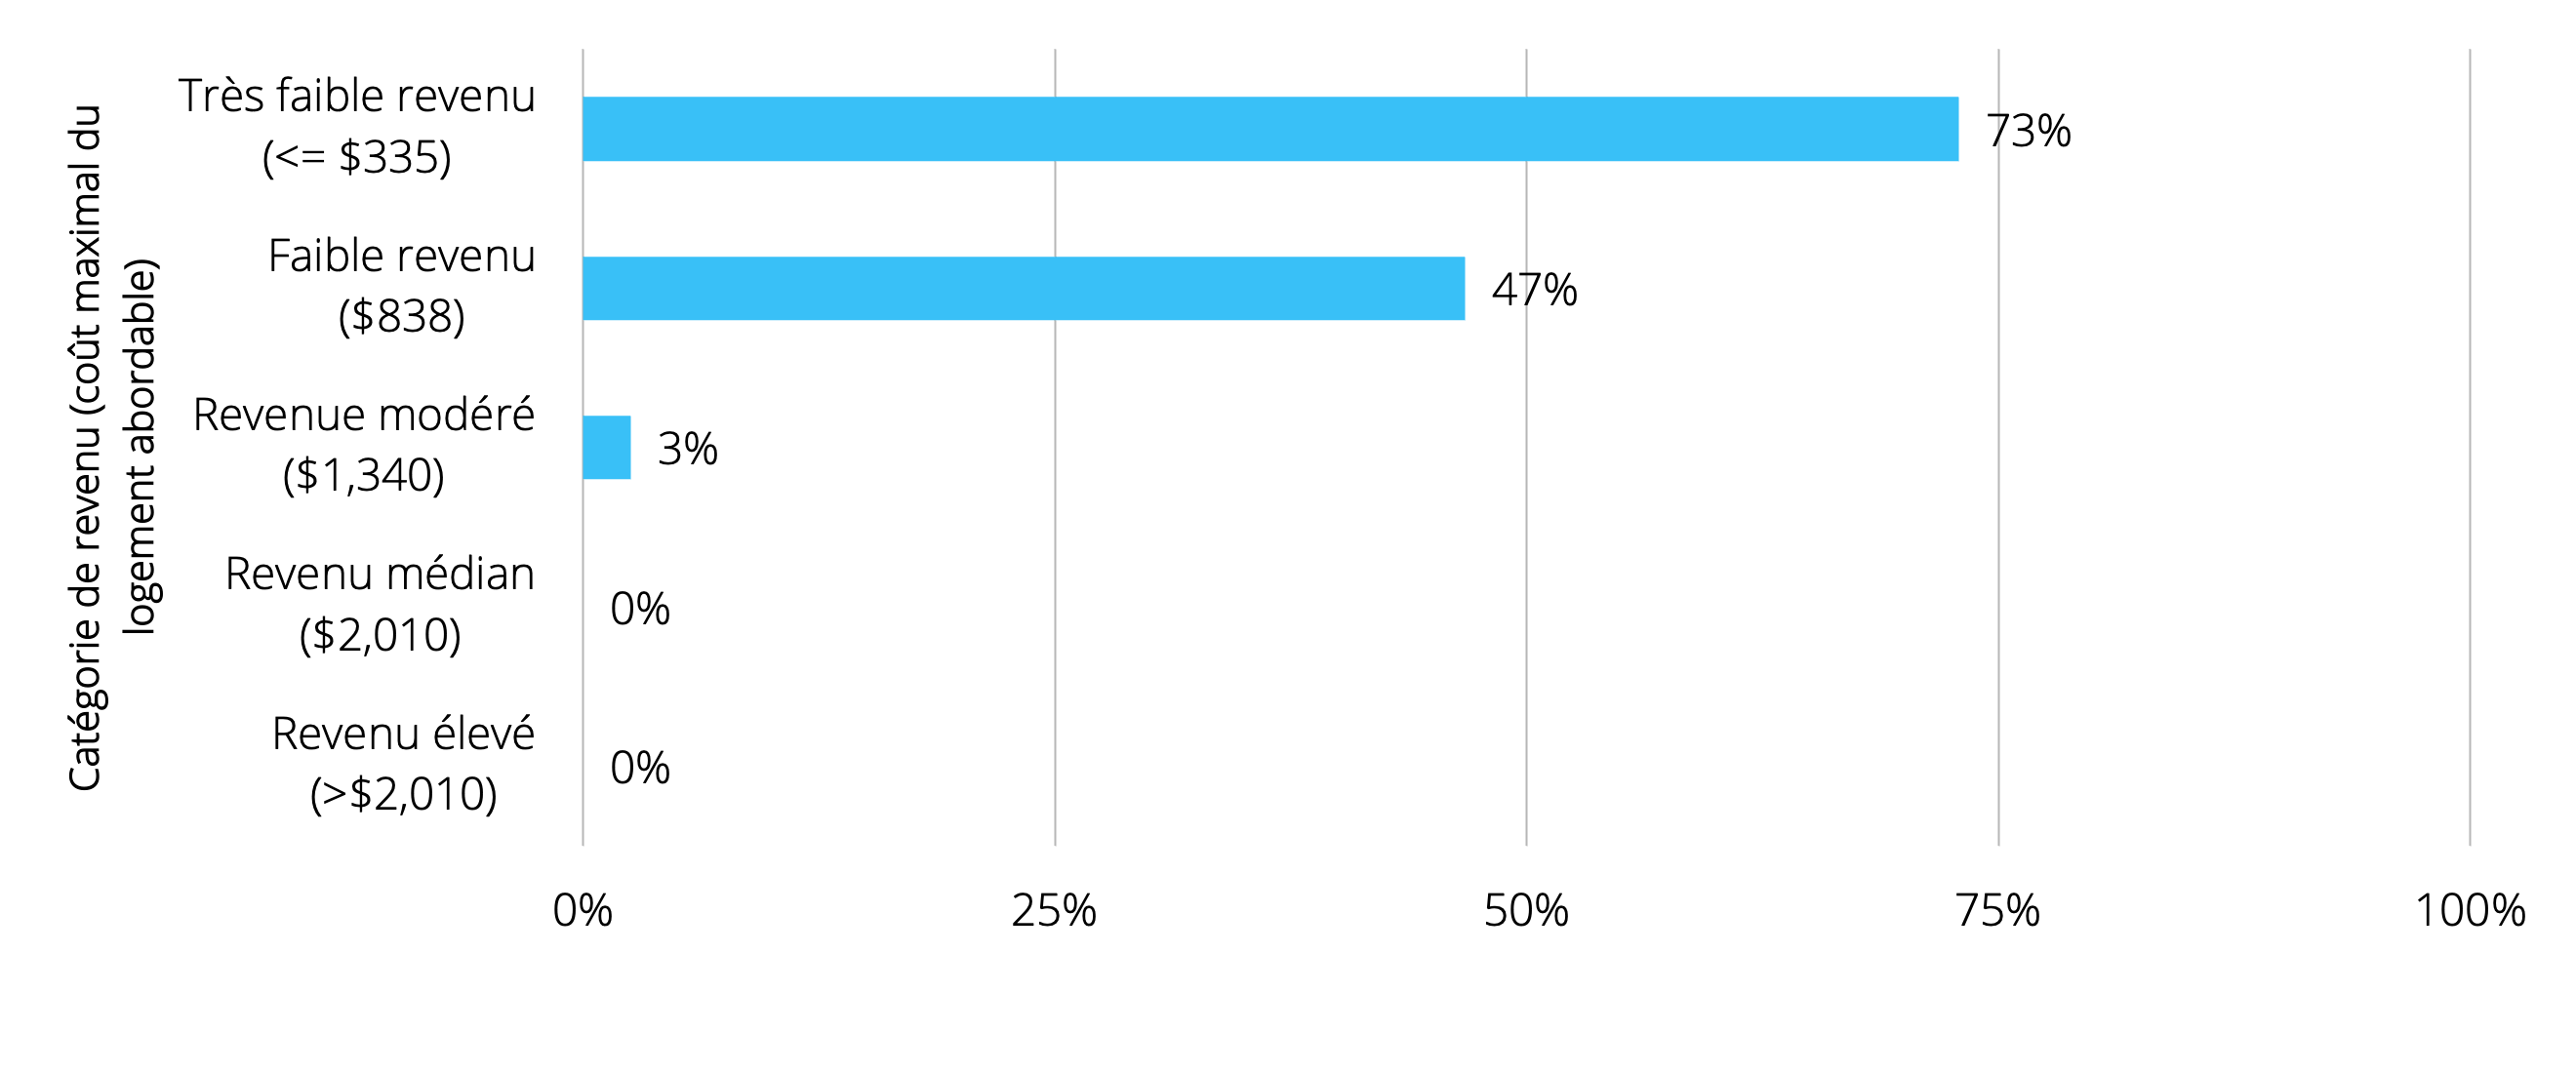
This graph shows the total proportion of households and number of households that were in core housing need in the community according to the 2021 census data. For example, this chart shows that almost 50% of households in the Low Income category (maximum affordable monthly shelter cost is $838) were in Core Housing Need.
Percent of Household Size Categories in Core Housing Need, by Income Category (2021)
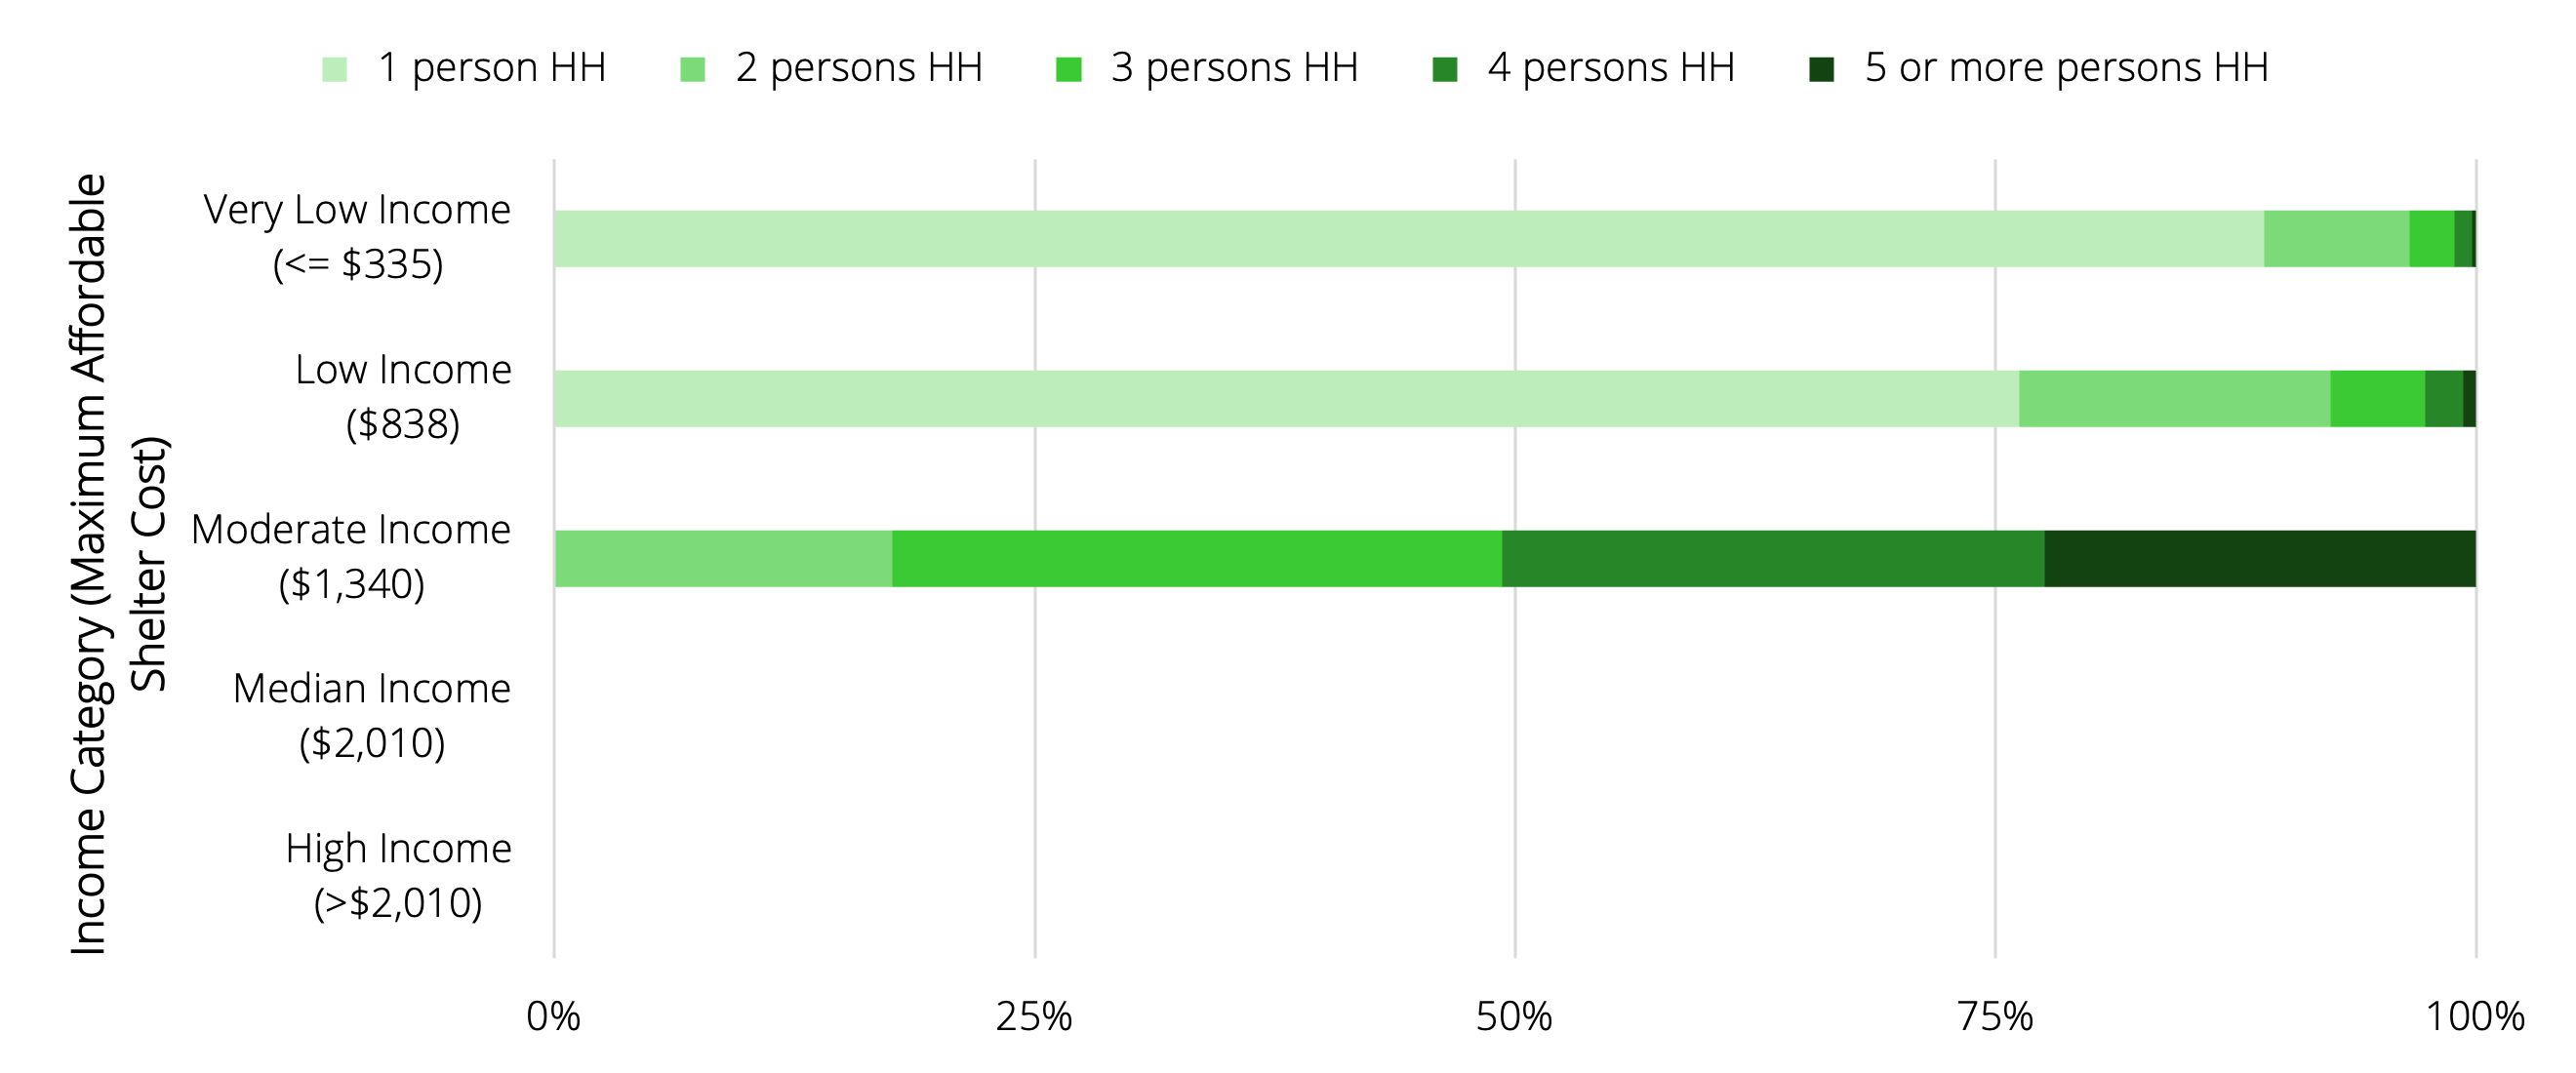

This graph shows the breakdown of household size for households in Core Housing Need. For example, this graph shows that of Moderate Income households (maximum affordable monthly shelter cost $1,340), over 50% of households in Core Housing Need were made up of four or more people.
Total Affordable Housing Deficit (2021)
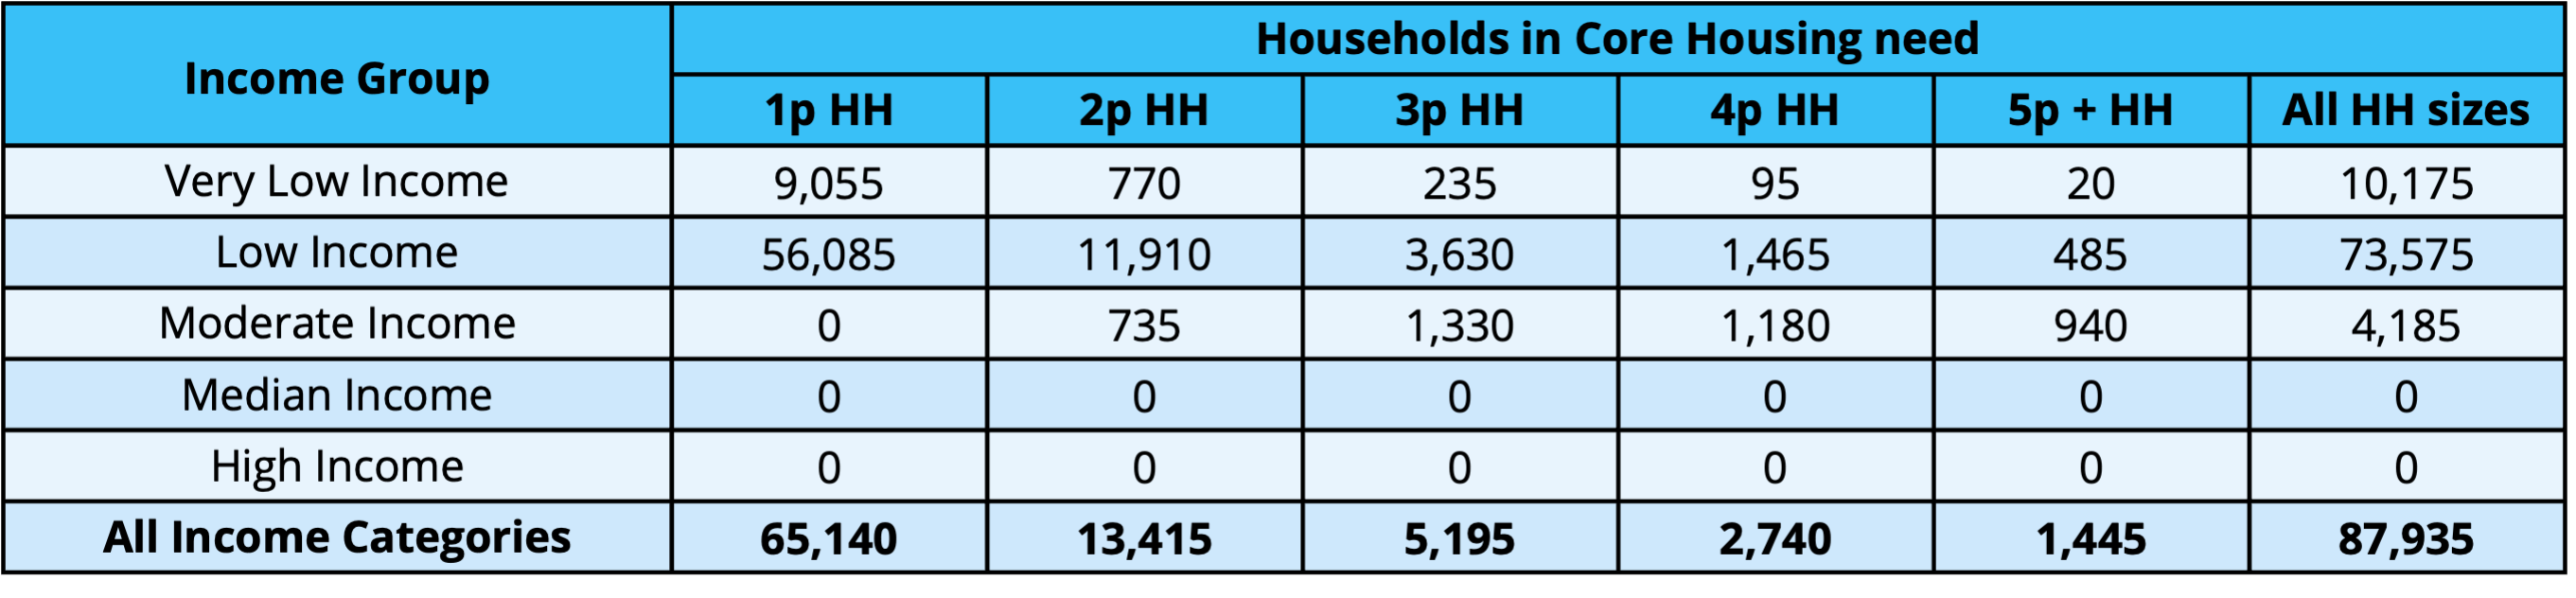
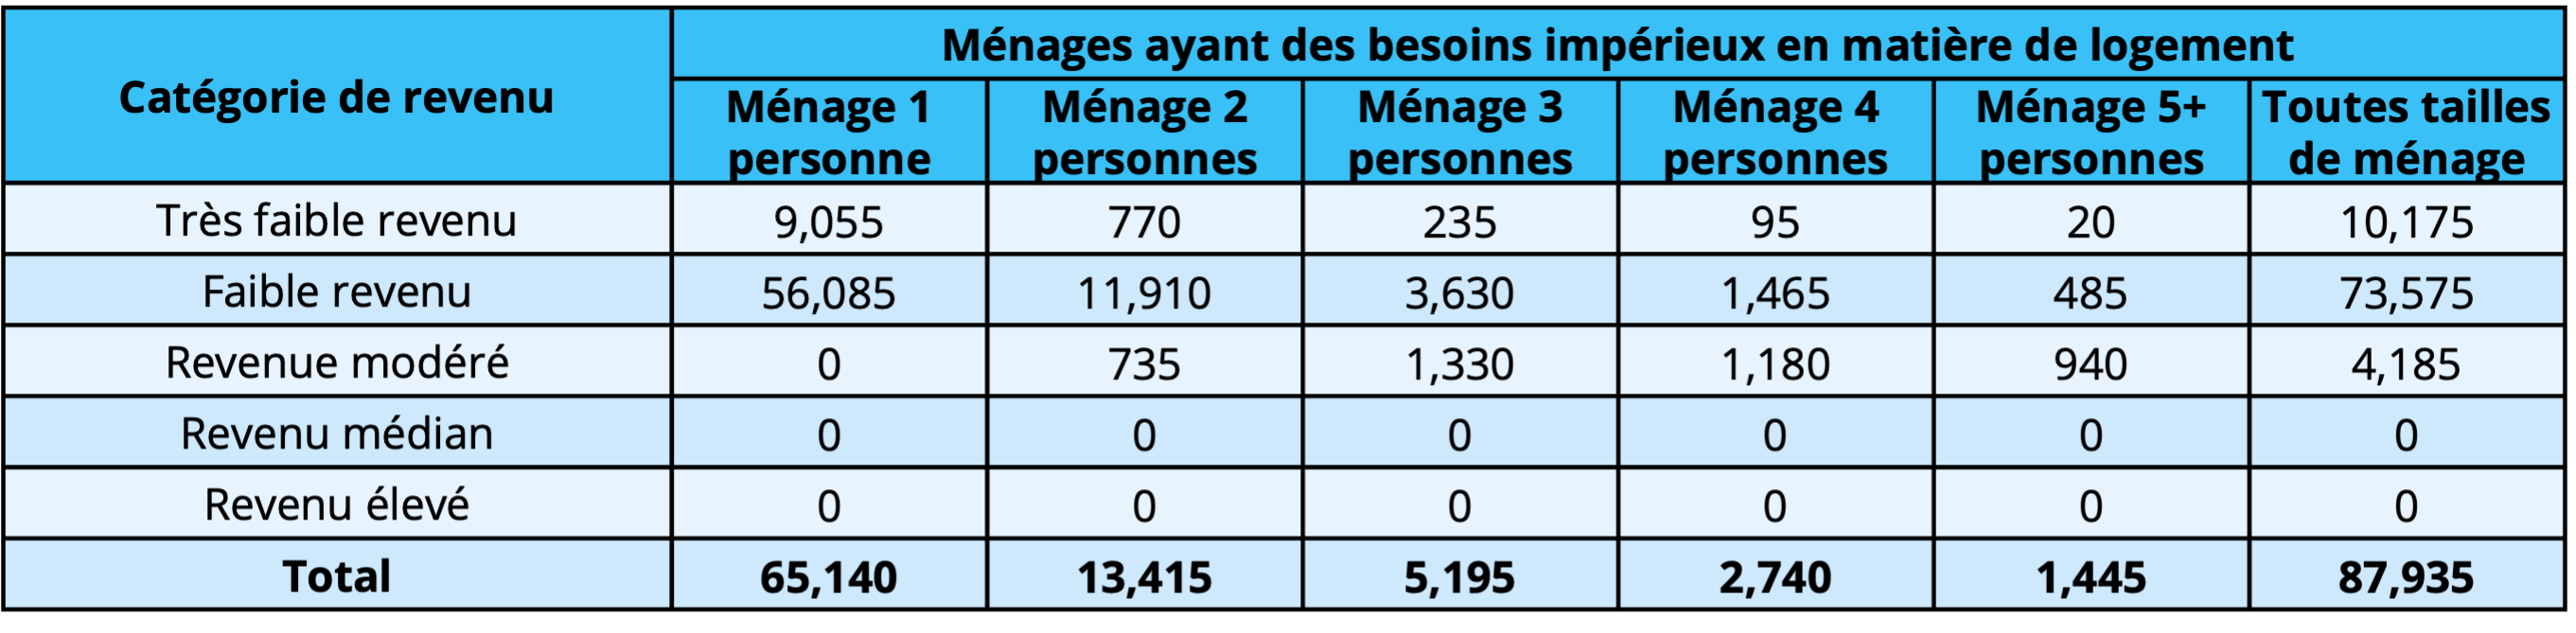
This table shows the 2021 existing housing deficit at each income category level. For example, in 2021 there was a deficit of at least 56,085 one-person homes that were affordable to Low Income households. This number does not necessarily indicate a lack of homes, but a lack of homes at or below the maximum affordable shelter cost for this income category.
Percentage of Households (HHs) in Core Housing Need, by Priority Population (2021)
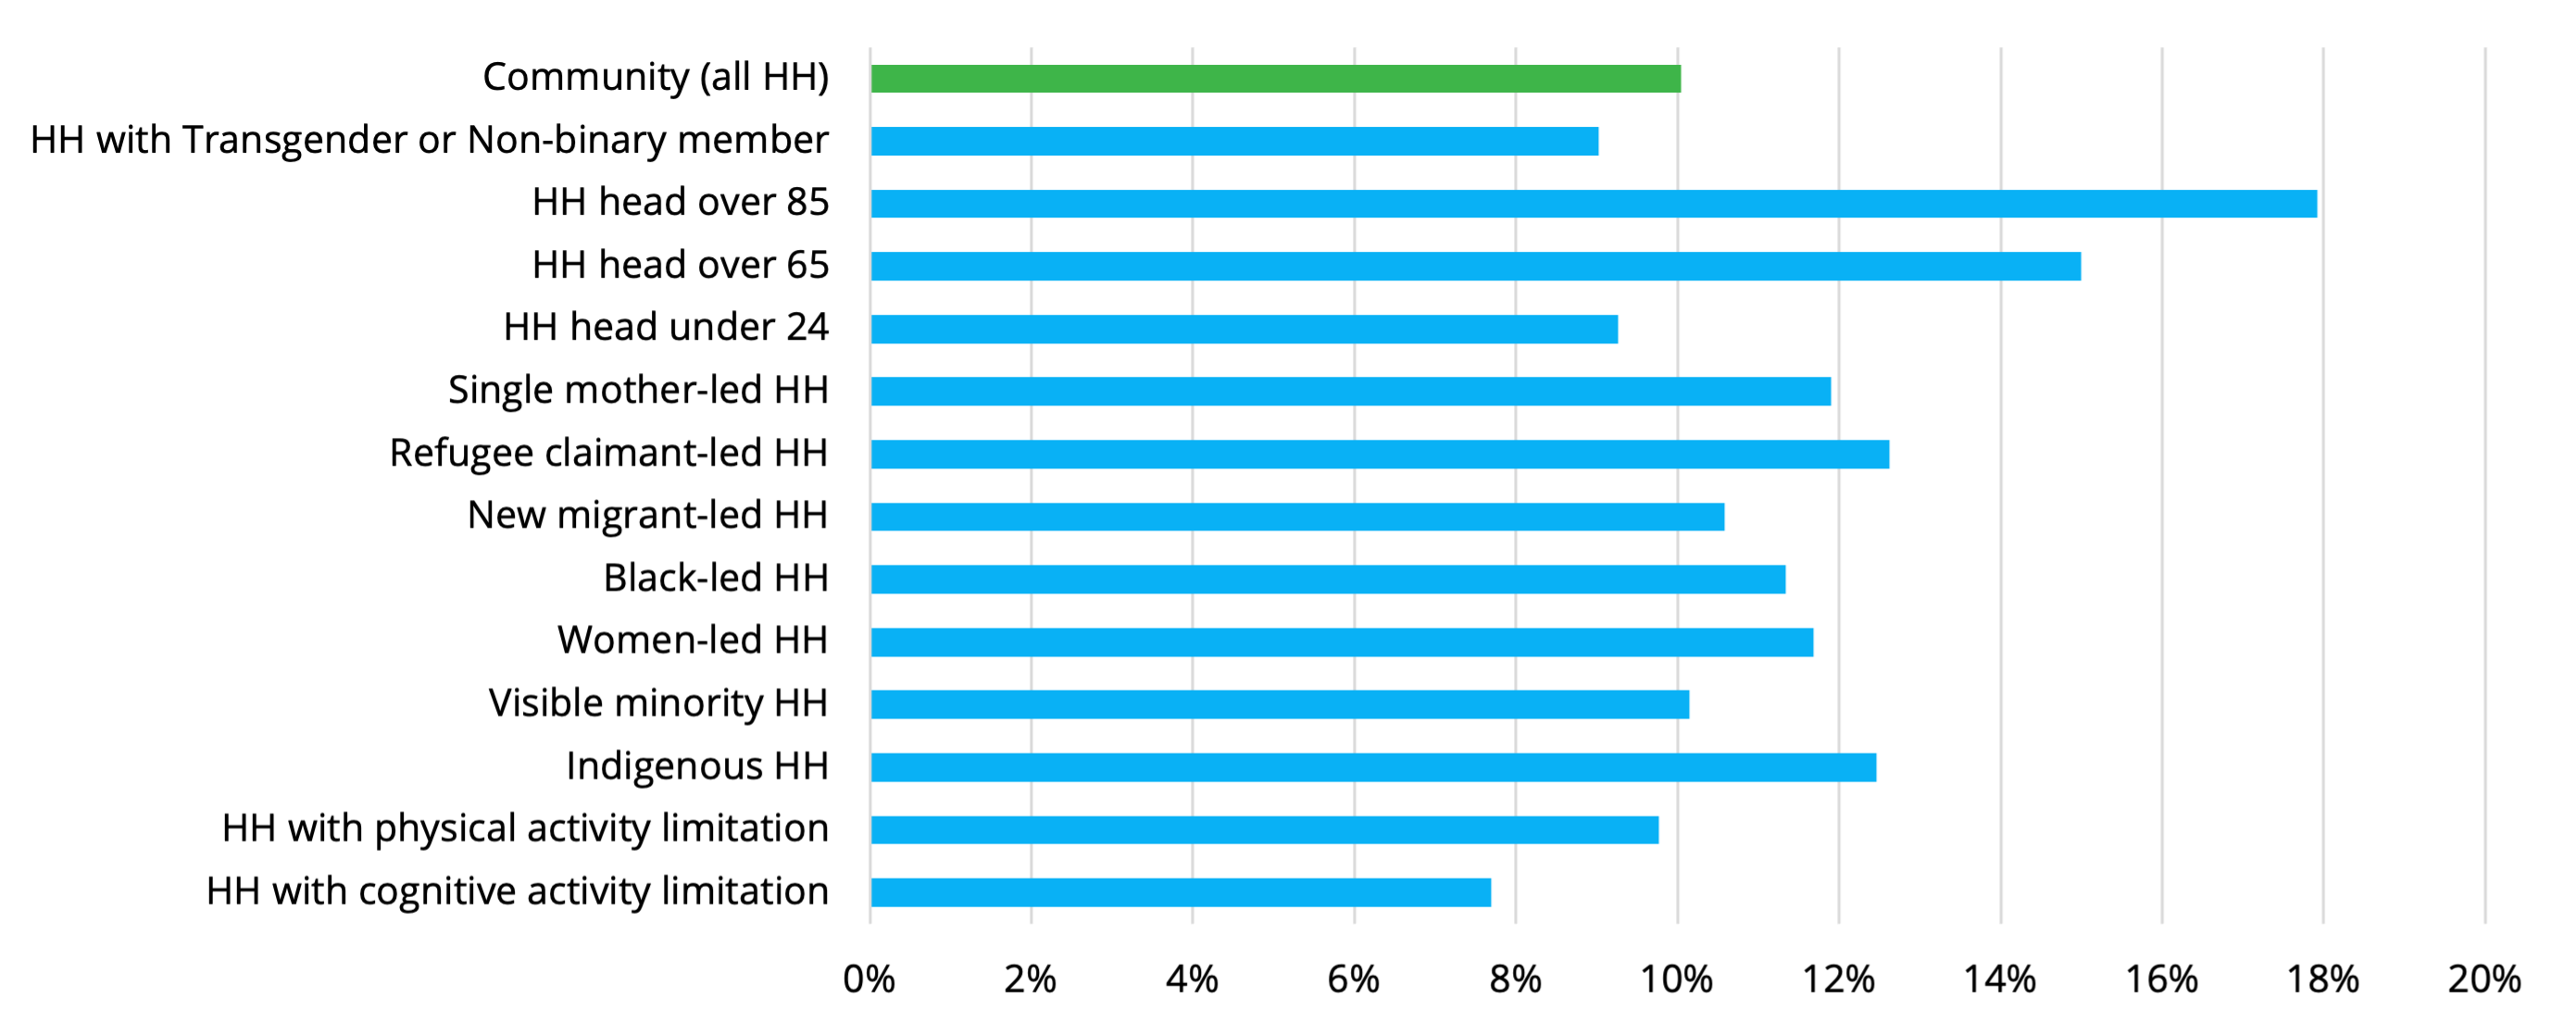
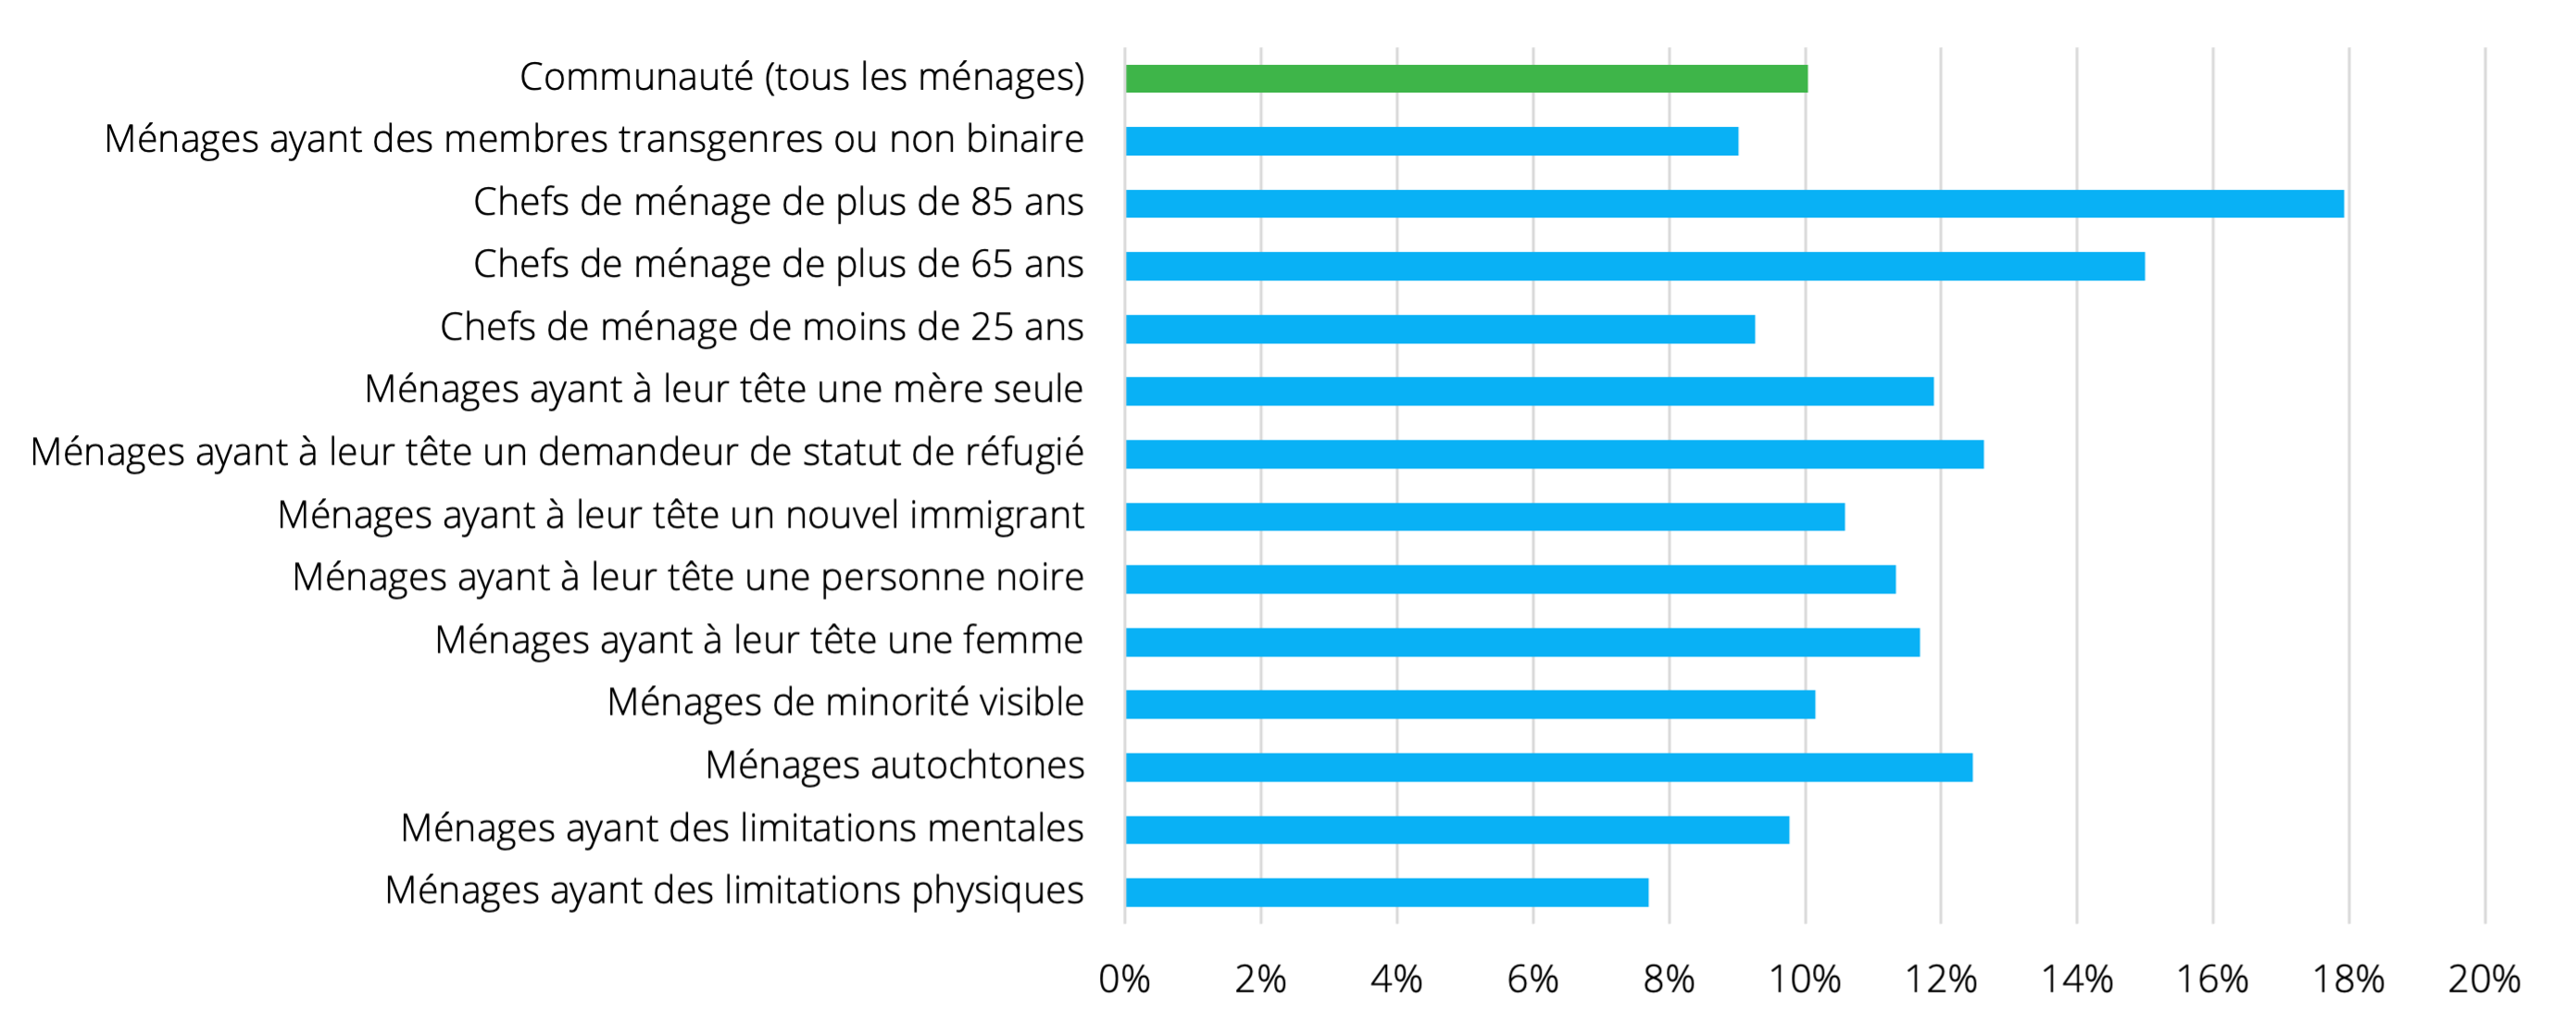
This graph shows the proportion of marginalized households in Core Housing Need against the proportion of all households in Core Housing Need. For example, households led by people over 85 are nearly twice as likely to be in Core Housing Need than that of the community as a whole.
For more information about the HART HNA data, read our FAQ or get in touch.